15 trading failures commonly committed by stock investment traders and how to avoid them:-
Thursday, 29 December 2011
Wednesday, 14 December 2011
[12.1] Trading US options for short term
In this article, I chose Citigroup Inc (C) to show you that trading US options can be profitable as long as you keep to a short term period and cut loss tightly to protect your capital.
Thursday, 24 November 2011
[11.3] Trading warrants
Warrants
Basically 2 main types of warrants that are popular with general retail traders:-
· Company issued warrants
· Institution issued warrants
Warrants are derivatives of mother stock and quite popular instruments in Asian markets like Hong Kong and Malaysia.
Wednesday, 16 November 2011
[11.2] Learning basics of US stock options
Hi readers!
If you are new to US stock options and wish to learn more
or find out more information, there is a step by step guide in this blog where
you can learn from basics. Below is an index of the various posts related to
the topic. OR, click on the MENU above....
Monday, 7 November 2011
[11.1] HK market back on uptrend?
Folks trading HK are excited that the bear market is bottoming
out but is the market really back on uptrend? I posted last month (see [10.7]
dated 16th October) and listed signals that would qualify the
uptrend.
About mid-October, the Hang Seng Index was:-
1. It has not crossed
the downtrend line yet
2. Though already above the base line, I prefer it to close above the box
3. The short term GMMA lines are still below the long term lines
4. Momentum is rising but still not strong enough to close near the zero line
2. Though already above the base line, I prefer it to close above the box
3. The short term GMMA lines are still below the long term lines
4. Momentum is rising but still not strong enough to close near the zero line
Let us take a look again at today’s prices.
Today's Index:-

- Already crossed the nearer term downtrend line (from high of August) but still below the longer term downtrend line (from the high of April).
- It has a strong support around 17800 and strong resistance at 20000 and already out of the October box.
- GMMA short term lines already crossed the long term lines
- Momentum is in bullish zone
So, does that mean the uptrend is intact? Not exactly so I
think. Here, I picked a few top movers (those with high trading volumes,
representing high demand) and found the following:-
To be really back on uptrend, stocks must be at least;
- 3 months high or near to it
- GMMA short term lines crossed the long term lines
- Price above the Ichimoku cloud
Lumena : basic material sector

Lumena is downtrending.
It is near to the 3 month high (top of box) area, near the top of the cloud
and GMMA yet to cross.
I think a great potential to bounce back up soon.
CNBM : construction & cement sector

It is still below the 3 month high (top of box) area, in the
cloud but GMMA crossed
Momentum is bullish but overall trend is still struggling to return back to uptrend
GCL Poly : energy & power sector

GCL-Poly is still far below the 3 month high area and still below the cloud.
Not back in the uptrend yet.
Not back in the uptrend yet.
Evergrande : property sector
 Evergrande is still far below the 3 month high area and still in the cloud.

Surely not back in the uptrend yet.
CNOOC : oil & gas sector


It is very near to the 3 month high area and GMMA crossed
This is a downtrending stock but now can be considered back
on uptrend unless it breaks below support (bottom of the box)
Stocks that rebound faster and back to the price range 3 months ago are potential buys.
CCB : bank sector

This is a downtrending stock but now can be considered back
on uptrend unless it breaks below support (bottom of the box)
China Life : insurance sector

It is near the 3 month high area and GMMA crossed
This is a downtrending stock but now is near to uptrend unless it breaks below support (bottom of the box)
Of course 7 stocks do not represent the whole market but these are all top movers (people like to trade them) and selected to cover a wide range of sectors. In conclusion, I think the downtrend has found bottom and the uptrend is about to begin.
Rebound patterns can be V-shaped (quick rebound) or U-shaped (more like a cup) or L-shaped (those slow response). Stocks that rebound faster should be potential buys.
Disclaimer: This article is for
education only and not a proposal, invitation or advice to buy or sell shares
or options.
Post a comment
|
Click the “COMMENT”
word
If you have difficulties under “profile”, you may use name/URL and write your name therein
Thank you for your visit
|
Tuesday, 1 November 2011
[10.9] S&P Sector ETF
In the blog news, there is an article on sector ETF and the best performing ETF were:-
Industrial, Energy & Utilities.
Here is a table of the popularly traded sector ETF:
Sector
| |
GDX
|
Market Vectors Trust Market Vectors Gold Miners
|
SMH
|
Semiconductor HOLDRS
|
XLB
|
Select Sector SPDR Materials
|
XLE
|
Select Sector SPDR Energy
|
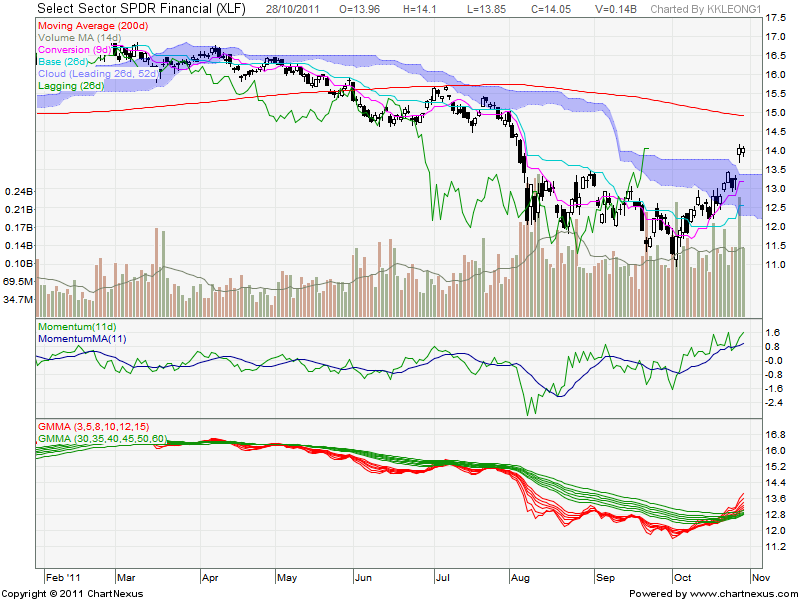
XLF
|
Select Sector SPDR Financial
|
XLI
|
Select Sector SPDR Industrial
|
XLK
|
Select Sector SPDR Technology
|
XLU
|
Select Sector SPDR Utilities
|
XLV
|
Select Sector SPDR Health Care
|
XLY
|
Select Sector SPDR Consumer Discretionary
|
XRT
|
SPDR S&P Retail
|
The Perfchart of the sector ETF for past 3 months’ performance

Utilities and Consumer are the leaders
The Perfchart of the sector ETF for last month


Energy and Financial are the leaders
{charts extracted from stockcharts.com, under free charts}
Let us look at some charts
Utilities and Energy are showing strong uptrend


Whereas Financial looks like downtrend rebound
So folks, before you do your selection, do check out the charts first. Analysis reports and performance charts may look attractive but still the charts tell the best stories.
You may also like to look at consumer

I prefer uptrending charts like XLE, XLU or XLY. All these have crossed above the 200 day MA.
XLF, XLB, XLI have a strong rebound but still below the 200 day MA.
My take is the chart that has moved high and above 200 DMA will move higher at a quicker pace compared to those charts that are downtrend rebound and still not reached the 200 DMA yet.
XLF, XLB, XLI have a strong rebound but still below the 200 day MA.
My take is the chart that has moved high and above 200 DMA will move higher at a quicker pace compared to those charts that are downtrend rebound and still not reached the 200 DMA yet.
The charts tell which are the best performers.
Post a comment
Click the “COMMENT” word
If you have difficulties under “profile”, you may use name/URL and write your name therein
Thank you for your visit
|
Subscribe to:
Posts (Atom)