15 trading failures commonly committed by stock investment traders and how to avoid them:-
Thursday, 29 December 2011
Wednesday, 14 December 2011
[12.1] Trading US options for short term
In this article, I chose Citigroup Inc (C) to show you that trading US options can be profitable as long as you keep to a short term period and cut loss tightly to protect your capital.
Thursday, 24 November 2011
[11.3] Trading warrants
Warrants
Basically 2 main types of warrants that are popular with general retail traders:-
· Company issued warrants
· Institution issued warrants
Warrants are derivatives of mother stock and quite popular instruments in Asian markets like Hong Kong and Malaysia.
Wednesday, 16 November 2011
[11.2] Learning basics of US stock options
Hi readers!
If you are new to US stock options and wish to learn more
or find out more information, there is a step by step guide in this blog where
you can learn from basics. Below is an index of the various posts related to
the topic. OR, click on the MENU above....
Monday, 7 November 2011
[11.1] HK market back on uptrend?
Folks trading HK are excited that the bear market is bottoming
out but is the market really back on uptrend? I posted last month (see [10.7]
dated 16th October) and listed signals that would qualify the
uptrend.
About mid-October, the Hang Seng Index was:-
1. It has not crossed
the downtrend line yet
2. Though already above the base line, I prefer it to close above the box
3. The short term GMMA lines are still below the long term lines
4. Momentum is rising but still not strong enough to close near the zero line
2. Though already above the base line, I prefer it to close above the box
3. The short term GMMA lines are still below the long term lines
4. Momentum is rising but still not strong enough to close near the zero line
Let us take a look again at today’s prices.
Today's Index:-

- Already crossed the nearer term downtrend line (from high of August) but still below the longer term downtrend line (from the high of April).
- It has a strong support around 17800 and strong resistance at 20000 and already out of the October box.
- GMMA short term lines already crossed the long term lines
- Momentum is in bullish zone
So, does that mean the uptrend is intact? Not exactly so I
think. Here, I picked a few top movers (those with high trading volumes,
representing high demand) and found the following:-
To be really back on uptrend, stocks must be at least;
- 3 months high or near to it
- GMMA short term lines crossed the long term lines
- Price above the Ichimoku cloud
Lumena : basic material sector

Lumena is downtrending.
It is near to the 3 month high (top of box) area, near the top of the cloud
and GMMA yet to cross.
I think a great potential to bounce back up soon.
CNBM : construction & cement sector

It is still below the 3 month high (top of box) area, in the
cloud but GMMA crossed
Momentum is bullish but overall trend is still struggling to return back to uptrend
GCL Poly : energy & power sector

GCL-Poly is still far below the 3 month high area and still below the cloud.
Not back in the uptrend yet.
Not back in the uptrend yet.
Evergrande : property sector
 Evergrande is still far below the 3 month high area and still in the cloud.

Surely not back in the uptrend yet.
CNOOC : oil & gas sector


It is very near to the 3 month high area and GMMA crossed
This is a downtrending stock but now can be considered back
on uptrend unless it breaks below support (bottom of the box)
Stocks that rebound faster and back to the price range 3 months ago are potential buys.
CCB : bank sector

This is a downtrending stock but now can be considered back
on uptrend unless it breaks below support (bottom of the box)
China Life : insurance sector

It is near the 3 month high area and GMMA crossed
This is a downtrending stock but now is near to uptrend unless it breaks below support (bottom of the box)
Of course 7 stocks do not represent the whole market but these are all top movers (people like to trade them) and selected to cover a wide range of sectors. In conclusion, I think the downtrend has found bottom and the uptrend is about to begin.
Rebound patterns can be V-shaped (quick rebound) or U-shaped (more like a cup) or L-shaped (those slow response). Stocks that rebound faster should be potential buys.
Disclaimer: This article is for
education only and not a proposal, invitation or advice to buy or sell shares
or options.
Post a comment
|
Click the “COMMENT”
word
If you have difficulties under “profile”, you may use name/URL and write your name therein
Thank you for your visit
|
Tuesday, 1 November 2011
[10.9] S&P Sector ETF
In the blog news, there is an article on sector ETF and the best performing ETF were:-
Industrial, Energy & Utilities.
Here is a table of the popularly traded sector ETF:
Sector
| |
GDX
|
Market Vectors Trust Market Vectors Gold Miners
|
SMH
|
Semiconductor HOLDRS
|
XLB
|
Select Sector SPDR Materials
|
XLE
|
Select Sector SPDR Energy
|
XLF
|
Select Sector SPDR Financial
|
XLI
|
Select Sector SPDR Industrial
|
XLK
|
Select Sector SPDR Technology
|
XLU
|
Select Sector SPDR Utilities
|
XLV
|
Select Sector SPDR Health Care
|
XLY
|
Select Sector SPDR Consumer Discretionary
|
XRT
|
SPDR S&P Retail
|
The Perfchart of the sector ETF for past 3 months’ performance

Utilities and Consumer are the leaders
The Perfchart of the sector ETF for last month


Energy and Financial are the leaders
{charts extracted from stockcharts.com, under free charts}
Let us look at some charts
Utilities and Energy are showing strong uptrend


Whereas Financial looks like downtrend rebound
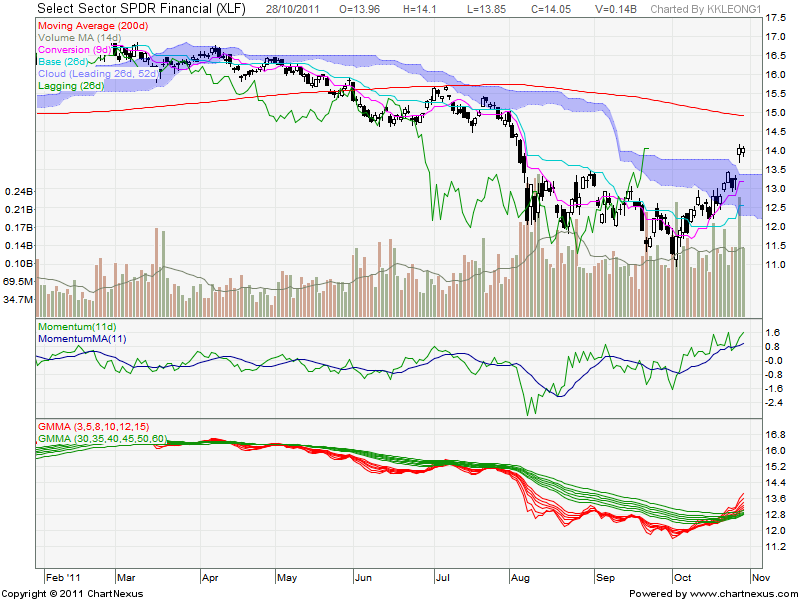
So folks, before you do your selection, do check out the charts first. Analysis reports and performance charts may look attractive but still the charts tell the best stories.
You may also like to look at consumer

I prefer uptrending charts like XLE, XLU or XLY. All these have crossed above the 200 day MA.
XLF, XLB, XLI have a strong rebound but still below the 200 day MA.
My take is the chart that has moved high and above 200 DMA will move higher at a quicker pace compared to those charts that are downtrend rebound and still not reached the 200 DMA yet.
XLF, XLB, XLI have a strong rebound but still below the 200 day MA.
My take is the chart that has moved high and above 200 DMA will move higher at a quicker pace compared to those charts that are downtrend rebound and still not reached the 200 DMA yet.
The charts tell which are the best performers.
Post a comment
Click the “COMMENT” word
If you have difficulties under “profile”, you may use name/URL and write your name therein
Thank you for your visit
|
Tuesday, 25 October 2011
[10.8] Trading plan, cashflow and stops
Folks, friends and acquaintances asked me about my trades
and I exclaimed “never better”. Some
confided in me with dejected looks and told me how much losses they have made.
From my own experience as well as that of most amateurs
in this stock trading game, most if not all folks don’t sell when prices acted
against their plan. Nicholas Darvas (who
wrote “How I made 2 million in the stock market”) said: Investors are pure gamblers when they stay with a stock even if it continues
to drop. A non gambler must get out when his stocks fall.
That is exactly how most traders became gambling investors and
console themselves that it is alright to hold on until the stocks pick up
again. In other words, they are willing to allow their hard-earned savings to
be thrown away indefinitely without any indicative evidence of recovery. It is
all HOPE!
Emotion
is the worst enemy in share market trading. Hence, a proper trading plan is
pertinent to ensure a higher probability of winning any trade.
1.
Cashflow plan
2.
Open positions
3.
stops
Cashflow plan
I usually encourage people to trade with money they can afford to lose.
Of course we do not like to lose money but at the very least, we do not have to
borrow money to cover the losses, if any.
Some like to trade with margins for leverage. In fact, it
is borrowing to gamble in the biggest casino if no proper plans are established.
For margin accounts, I
propose to use the funds (borrowing) to add positions in advancing and winning trades only.
Open positions
The next area of concern is the number of opened positions.
Novice in share trading like to ask for tips and buy whatever sounded good. In
the end, he/she has many opened counters. It will be difficult to monitor.
Some gurus encourage a 50/50 win/loss ratio. That means,
open 10 trades in 10 counters and hope 5 win with 10% profits and 5 with 5% cut
loss. I am not sure how these will enhance chart reading skills and instead may
confuse the person following such manner. I prefer 2 or most 3 at one time. Nicholas Darvas (who wrote “How I made 2 million in the stock
market”) had many positions and ended not much gain/loss but he made his big
money through a few stocks.
Watch a few strong performers and buy one or two
(depending on your capital size). Smaller capital traders should hold a small portfolio of one or two.
Stops
Nowadays, most stock brokers have online platforms to
trade and the software have elaborated “Stops” of many combinations.
First
entry in every trade must have a stop loss – this is the support level from the charts.
Next,
when the stock prices begin to rise, move the stop up to the breakeven level so that you
will not lose if the price suddenly reverses.
Finally, monitor the stock movement daily by looking at
the end-of-day chart
only. As a busy employee trying to make extra money, you have no time to check
prices in the day. Most successful traders don’t look at prices in the opening
hours.
Let the price run until weak signals appear. Sell when weakness confirm.
Post a comment
|
Click the “COMMENT” word
If you have difficulties under “profile”, you may use name/URL and write your name therein
Thank
you for your visit
|
Monday, 17 October 2011
[10.7] Is HK market back on up trend?
HK market has run up quite strongly last few days but still needs a bit more convincing indications. Let us look at the Hang Seng Index chart:

1. It has not crossed the downtrend line yet
2. Though already above the base line, I prefer it to close above the box
3. The short term GMMA lines are still below the long term lines
4. Momentum is rising but still not strong enough to close near the zero line
5. Last Friday closed down with quite a fair bit of profit taking (but reduced volume)
If Monday rises, then the bull may be staying for quite a while. In following trend, and maybe lead by US market, I will consider long trades instead.
Stock markets are fill with sentiments. There may be plenty of bearish news from EU and the West but still Asian markets rise together with the West. Still the same - follow the trend to trade.
Sunday, 16 October 2011
[10-.6] US market back on uptrend
Take a look at the S&P500 index chart:
1. The Ichimoku Cloud conversion line (9 day) touch the base line (26 day)
2. The momentum indicator touch the zero level
3. The Guppy GMMA short term lines cross above the long term lines
4. Last Friday's closed above and out of the box
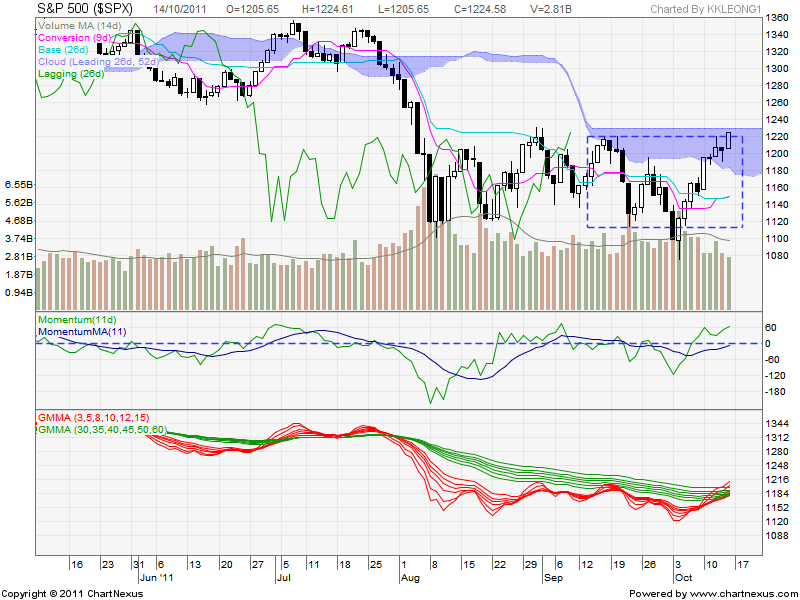
Any further rise above 1230 will hit the top of the cloud.
I will not predict the direction of the market but follow the trend of the market.
If the chart shows up trend, I will trade long and buy call. Of course I will protect my trades and set stop loss in case the trend changes down. For the time being, there are more signs of strength than otherwise.
Do you notice that last Thursday was a hammer candle and follow by a strong marubosu candle?
Thursday, 13 October 2011
Sunday, 9 October 2011
[10.4] free stock screener for HK stocks
Do you know you can screen for good stocks to trade in the
HK share market? Even better that it is free provided by Google Finance,
isn’t it?
The key problem is it is in Chinese.
To open it in English, use Google Chrome with translation.
Criteria for up trending stocks:-
- Volume – set to 2 million shares (if in Chinese, set to 200* minimum){to filter out those laggard stocks that are not in the institutional portfolio}
- Price at 13 week gain (i.e. at least 3 month or quarter high – up trending)
- Earnings per share positive (good fundamentals)
- Business data, return on equity positive in recent years (good fundamentals)
- 5 year profit growth positive
link for up trend:
Last scan results:-
CLP, Cheung Kong (1038), China Mobile (941)
Criteria for down trending stocks ready to short:-
- Volume – set to 2 million shares (if in Chinese, set to 200* minimum){to filter out those laggard stocks that are not in the institutional portfolio}
- Price at 52 week low (one year low stocks confirmed down trending)
- Earnings per share positive (good fundamentals)
- Business data, return on equity positive in recent years (good fundamentals)
- 5 year profit growth positive
link for downtrend:
Last scan results with top volumes:-
CMBM, Sinopec, Jiangxi Copper, China Life, etc

Subscribe to:
Posts (Atom)