Take a look at the S&P500 index chart:
1. The Ichimoku Cloud conversion line (9 day) touch the base line (26 day)
2. The momentum indicator touch the zero level
3. The Guppy GMMA short term lines cross above the long term lines
4. Last Friday's closed above and out of the box
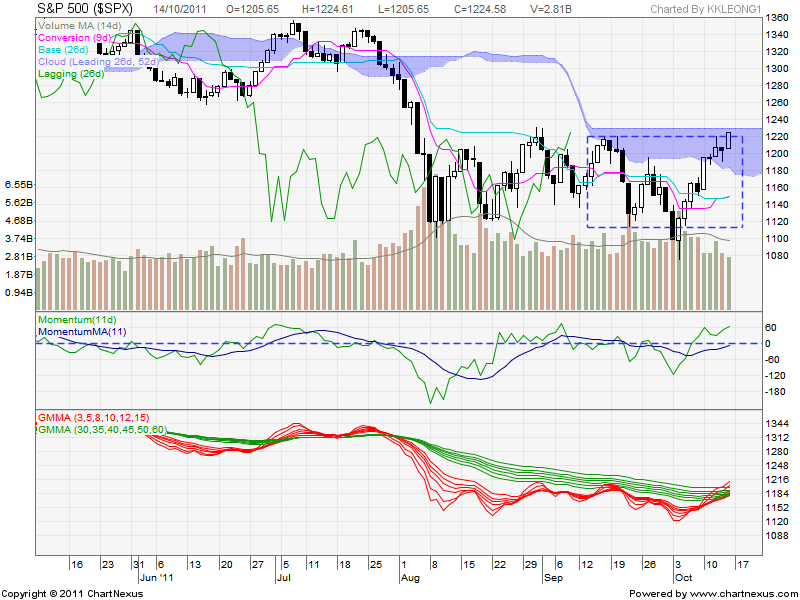
Any further rise above 1230 will hit the top of the cloud.
I will not predict the direction of the market but follow the trend of the market.
If the chart shows up trend, I will trade long and buy call. Of course I will protect my trades and set stop loss in case the trend changes down. For the time being, there are more signs of strength than otherwise.
Do you notice that last Thursday was a hammer candle and follow by a strong marubosu candle?
No comments:
Post a Comment